Have you ever wondered how much weight you should be losing on a ketogenic diet in a day, a week or a year? Use this weight loss benchmarking tool to understand if your weight loss is on track. (Based on a review of weight loss achieved by participants of 12 ketogenic diet research studies)
Low-carbohydrate diets have proven themselves as an effective way to lose weight [note] Mansoor, Nadia, et al. Effects of low-carbohydrate diets v. low-fat diets on body weight and cardiovascular risk factors: a meta-analysis of randomised controlled trials.British Journal of Nutrition 115.3 (2016): 466-479 [/note]. Less studies use the ketogenic diet as a weight loss tool. But those that do are setting a new standard for weight loss.
The definition of a Ketogenic diet is a very low carbohydrate high-fat diet (20–50 g CHO/day or <10% of daily kcal of 2000 kcal/day diet).[note]Noakes, Timothy David, and Johann Windt. Evidence that supports the prescription of low-carbohydrate high-fat diets: a narrative review.Br J Sports Med 51.2 (2017): 133-139.[/note]
There are many stories of rapid weight loss spread across the web. However, not all of the diets used have real scientific evidence behind them. From our internal data, and numerous clinical studies, we have developed an accurate guide for weight loss when following a KD.
In this article, we’ll identify the evidence-based range for weight loss, why you may not be in that range, and how weight loss differs over time on a KD. We will also briefly investigate the studies behind the ketosource tool.
Read on to learn more about:
- The Ketogenic Diet Weight Loss Benchmarking Tool
- Are You On Target?
- Slowing Rate Over Time
- Takeaways
The Ketogenic Diet Weight Loss Benchmarking Tool
The evidence-based tool is built from a review of 32 ketogenic diet weight loss studies, with a final data set including 12 studies. Studies, or parts of the studies, were excluded if participants were not following a KD or there was a lack of compliance. For the full breakdown check out the white paper.
The chart can be used in a few different situations as follows. If you are contemplating a KD for weight loss you can see how long it will take to reach your target weight. If you are already following a KD, you can see if are within the correct weight loss range based on the science.
The chart starts at week 0 and shows the range of weight loss to expect in your first year on a KD. All you need to do is figure out how many weeks you have been on a KD. Then you can compare your weight loss (kg) with the range on the chart for your current week. This will tell you if you are on track according to the data.
The Ketogenic Diet Weight Loss Benchmarking Tool
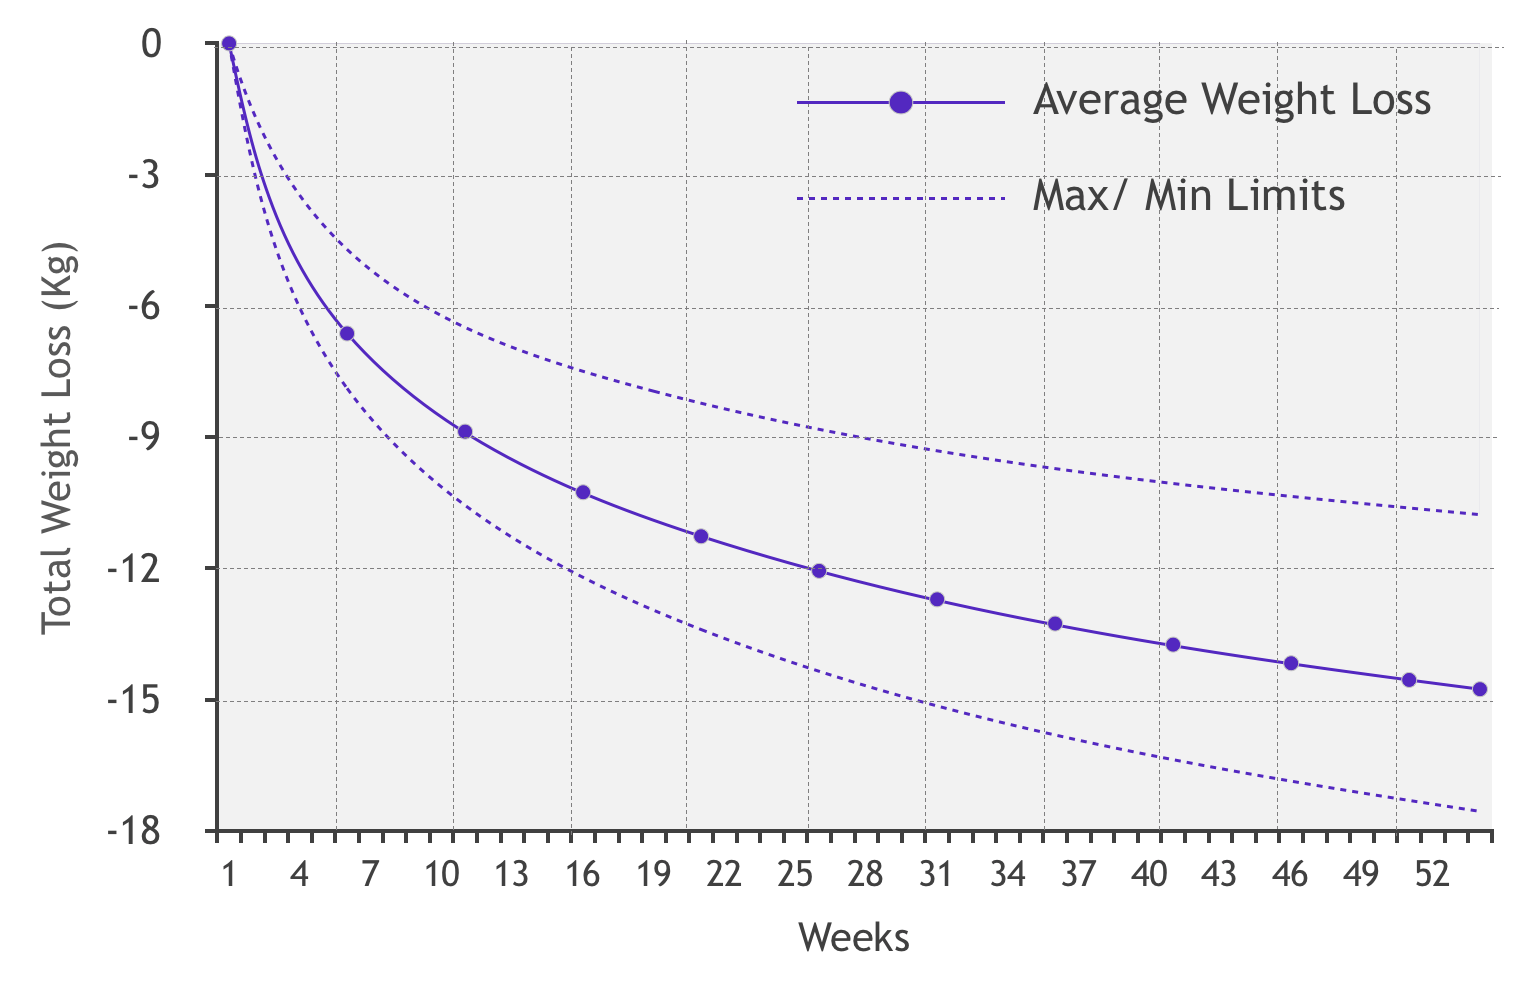
For example, if you have been following a ketogenic diet for 10 weeks and have lost -8.5kg then you are on track. As you can see on the chart, the average weight loss for week 10 is -9kg. So if you have lost between -6kg and -10.5kg then your weight loss is in line with the studies. If you have lost less than -6kg for instance then you need to review your KD lifestyle.
The benchmarking tool is in its first stage of life and can be seen as preliminary. The chart will evolve overtime as new studies come out and we collect more client data. (Note: If you are looking to lose weight, then you can contribute to this useful tool by signing up to our coaching practice ).
Are you on target?
You have been following the KD diet, diligently tracking your weight and carbohydrate intake. But you seem to be falling short of the minimum weight loss limit. To make it worse your friend who started at the same time is almost exceeding the maximum weight loss limit! So what is going on here?
Adherence and carbohydrate intake
The first suspect is always a lack of adherence. This may be unintentional, such as those Grenade bars you have been eating every day, that you happily thought were ketogenic. Or perhaps it’s just one too many sneaky cashews on a regular basis. But jokes aside, no diet works unless you stick to it, period.
When looking at the Ketogenic Diet studies there is an association between following the diet properly, and increased weight loss. Typically the more support the participants received in the studies, the closer they followed the diet. And consequently the more weight they lost.
A recent study by Mckenzie (2017) showed a high rate of weight loss. This was a result of regular counselling sessions and ketone tracking to ensure participants were in ketosis [note]McKenzie, Amy L., et al. A novel intervention including individualized nutritional recommendations reduces hemoglobin A1c level, medication use, and weight in type 2 diabetes JMIR Diabetes 2.1 (2017): e5.[/note]. This is something we regularly do with our clients in our coaching practise to achieve the best weight loss results.
On the flip side an older study by Foster (2013) had minimal professional contact leading to poor adherence and more dropouts [note]Foster, Gary D., et al.A randomized trial of low-carbohydrate diet for obesity. New England Journal of Medicine 348.21 (2003): 2082-2090.[/note]. This resulted in a slower rate of weight loss.
Next is the how many carbohydrates you eat. The study with the least amount of short-term weight loss had a higher carbohydrate intake, around 41g or 11% of calorie intake per day. Whereas, in Brinkworth’s 2009 study a low carbohydrate threshold of under 36g, and good adherence, led to a greater rate of weight loss over a year.
It has been shown in previous studies that lower carbohydrate intake is equal to greater weight loss [note]Young, Charlotte M., et al. Effect on body composition and other parameters in obese young men of carbohydrate level of reduction diet.The American journal of clinical nutrition 24.3 (1971): 290-296.[/note]. However, there was a 30g difference between the low carbohydrate groups with the lowest eating 30g per day whilst the higher diets had 60g and 104g per day.
Apart from actually following the Ketogenic Diet correctly and keeping your carbohydrates low, there are a number of other factors which can alter your weight loss results.
Why Do Some People Lose More than Others?
Weight loss can vary depending on a number of inherent factors. For instance, your starting weight, genetics and gender all play a role in how much weight you will lose. These factors could account for the different high and low weight loss limits seen on the chart each week.
Your baseline weight massively effects the amount of weight you can expect to lose. With a greater starting weight you have a lot more weight to lose before you will reach your ideal weight. Therefore, when the pounds start to drop the weight loss will look like a landslide on the chart.
If however, you are only slightly overweight, then weight loss will be a lot less and it may even cease altogether when your body reaches its ideal weight. Likewise, male and female weight loss will be different.
For example, McKenzie (2017) had an average participant starting weight of 117kg and thus saw rapid weight loss. Another study by Volek (2002) used healthy weight male volunteers so as to be expected the weight loss was much lower. For more examples delve into the white paper
To illustrate the differences in gender, one of the studies split participants into a male and female group [note]Volek, Jeff S., et al. Body composition and hormonal responses to a carbohydrate-restricted diet. Metabolism-Clinical and Experimental 51.7 (2002): 864-870.[/note]. The males lost over 2x the amount lost by the females in the study.
Then you also have genetics whose role is a website in itself. Briefly polymorphisms in the fat mass and obesity-associated protein (FTO) gene can influence genetic obesity risk [note] Claussnitzer, Melina, et al. FTO obesity variant circuitry and adipocyte browning in humans. New England Journal of Medicine 373.10 (2015): 895-907.[/note]. But bear in mind that your lifestyle can influence fat loss more than genetics
Rate of Weight Loss Slows Over Time
Have you ever followed a diet only to lose weight in the first two weeks before stalling? The KD is renowned for rapid weight loss in the beginning as can be seen by the studies in the chart below.
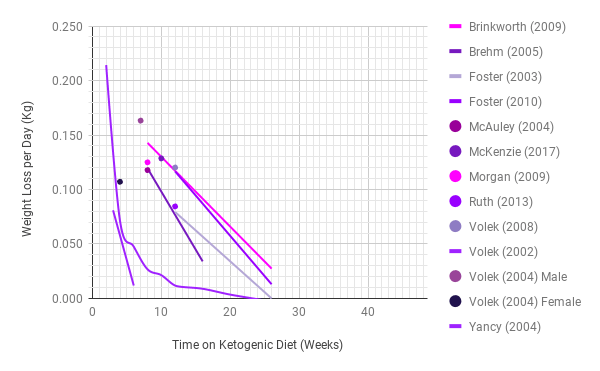
As you can see on the chart weight loss starts between 100 to 200 grams per day (700 to 1400 grams per week) and drops over time to around 50 grams per day (350 grams per week). The initial drop you see is usually due to glycogen depletion. With each gram of glycogen comes three grams of water, therefore the initial weight loss could be “water weight”.
Glycogen is the bodies glucose storage and is the reason why if you cheat on a KD you may see a jump on the scales the next day[note]Berg JM, Tymoczko JL, Stryer L. Biochemistry. 5th edition: Chapter 21, Glycogen Metabolism New York: W H Freeman; 2002.[/note]. This is due to the repletion of glycogen and therefore more water moving into your muscles and liver.
Yet after this initial weight loss, the remainder of weight loss will come from fat stores. As illustrated in a previous study where the entire loss in body weight was from fat, with significant increase in lean body mass 6.
Rate of weight loss will always slow as you approach your ideal weight regardless of your diet. This is because you body needs a certain amount of essential fat as to stay in good health. For instance body fat under 6-8% and 13-15%, in men and woman respectively, can cause hormonal and metabolic suppression [note]Gallagher, Dympna, et al. Healthy percentage body fat ranges: an approach for developing guidelines based on body mass index. The American journal of clinical nutrition 72.3 (2000): 694-701.[/note].
Other factors affecting the rate of weight loss are exercise, sleep, and risk factors. Exercise can increase the rate of weight loss whilst lack of sleep can reduce weight loss. Therefore it is important to get good quality sleep for a suitable duration. Likewise, if the rate of weight loss slows, you may consider adding in or increasing exercise.
Takeaways
- The benchmarking tool lets you understand if you are in the right weight loss range on a KD.
- The tool is evidence-based and will evolve over time from both client data and the latest studies.
- The better the adherence, and the lower carbohydrate intake is, the greater the weight loss appears to be.
- Starting weight, genetics and gender all affect how much weight you will lose.
- The rate of weight loss on a Ketogenic Diet
slows over time due to water weight and can be altered by other lifestyle factors.
Download the White Paper for the Full Analysis
This article is a summary of our analysis and the ketogenic diet weight loss benchmarking tool. For the full analysis download the white paper.
Click Here to Download White Paper – Ketogenic Diet Weight Loss Benchmarks